As I write this, disability justice advocates are rallying in opposition to Bill C-7, which will amend sections of the criminal code that pertain to MAiD: medical assistance in dying. In this short reflection, I’ll discuss medical assistance in dying in relation to disability, as a way to consider forms of relating and access that are vital to ensuring mutual flourishing.
Critics of Bill C-7 say it puts disabled people at risk because of systemic and structural failures to support their lives. The lives of disabled people are routinely portrayed as difficult, depressing, or painful. A subtext, that sometimes becomes overt text, is that the hardships of some disabled lives are so extreme that the people living these lives ought to prefer death. However, as the disability scholar and activist Kelly Fritsch taught me, disability is not something that is in a person. It is a relationship between a person and a world; we are rendered disabled in different ways, and to different degrees, by the worlds we inhabit. Fritsch frames this in terms of “debility” and “capacity,” writing that these “are not absolute categories pertaining to individual bodies.” She continues that these concepts “draw attention to what bodies do.”
Bodies can and cannot do things for a wide variety of reasons, but when we render spaces inaccessible, we close off potential doings. This should be understood non-normatively. There are lots of necessary and legitimate reasons to close off certain spaces for certain people; parents’ bedrooms have doors for a reason. However, when some people are systematically excluded because of their bodily differences, inaccessibility becomes a mode of oppression.
The oppression of disabled people obviously harms those excluded. But the harms compound because, to paraphrase Deleuze’s favourite line from Spinoza, no one knows what a disabled body can do. Similar phrasing is taken up by Amanda Cachia, in her exhibition “What Can a Body Do?” [pdf] Cachia explains that Deleuze is drawing attention to the fact that “we haven’t even begun to understand the potential of our own bodies,” and that “most of us know even less about the disabled body.” When we systematically exclude certain bodies from certain spaces, whether due to inaccessible infrastructure or a lack of basic material supports, we don’t just diminish the possibilities for those individuals, we diminish the possibilities for our communities.
We can think of access as creating conditions for a flourishing of bodies doing things.
The piece begins with a black screen while Germain, a visual translator for Blind audiences, describes a video of Deaf artist Jody Cripps performing a poem through what I understand to be a combination of American Sign Language and other gestures. In her introduction, Germain noted that the standard practice of visual translation is to be “as neutral as possible.” This performs the pretence that translation can be pure intermediation, leaving the translated object unchanged. Germain’s translation exceeds the description. Her voice emotes. Because at this point in the project, the viewer cannot see Cripps, I assumed the emotion in Germain’s voice conveyed attributes of the performance that would be lost in an affectless delivery. This is a key to Germain’s intention, which is to question whether her translation of a visual artwork for a Blind audience is itself a work of art.
Germain notes that she has not yet answered the question and continues to think about it. I will not be arrogant enough to offer my own answer—rather, I am taken by what I’m thinking of as the generative excess that exists in the sequence of translations performed in Germain’s project. In Germain’s introduction to the piece, she notes that the project’s title alludes to the “very visual world of the Deaf communities, and the very audio world of the Blind communities.” This attuned me, as a seeing and hearing person, to the existence of visual and aural excesses that are meaningful to Deaf and Blind people, but which may escape my understanding. By feeding Cripps’ performance through visual description for a Blind audience, there will necessarily be something lost. But there will also be something gained, as alluded to by the title’s invocation of the classic children’s game of “broken telephone.” But that excess is also highly generative. The Blind audiences that engage with Cripps’ work through Germain’s visual description will take something else from the work. Who knows what else that ‘something more’ might generate?
All of this brings me back to my own intellectual obsession: the translation of quality into quantity. Within our capitalist societies, the predominant language that is both mechanism and outcome of this translation is price. Price is relevant to the issue I raised to open this piece: providing adequate support to capacitate rather than debilitate people with disabilities. Cost will be raised as the obstacle. Politicians and bureaucrats will adopt hang-dog expressions, and speak in condescending tones, about how their heart breaks, but we just cannot afford to provide for the needs of certain people. They displace responsibility onto the cold, hard facts of economics. However, Germain’s project, and the attention that it draws to the losses and gains that occur through translation can equip us to question this invocation of prices as given.
Germain’s piece raises the obvious question of “who is translating?” By piercing the pretence of neutrality, and bringing herself into the process, we have a right to ask who she is, and what equips her to offer this translation? Although the inputs to price as a language of translation are different than the inputs to the translations in Germain’s project, similar questions should be raised when we are told that adequate care for all people would just cost too much. What is being priced? Who is doing the pricing? How are they doing the pricing? With what information and equipment are these prices being constructed?
Most disabilities that put people at risk of MAiD due to a lack of public support require some basic material resources and forms of caring labour. Canada has access to an abundance of material resources; more than enough to provide the basics of housing, clothing, food. Canada also has plenty of labour. In other words, Canada can afford to provide everyone with everything they need. That does not mean everyone is provided with the same things. Rather, it means working together to create universal access.
As Fritsch and Hamraie state, “Accessible futures require our interdependence.” The pandemic has crystallized and shone a light on perhaps the dominant fact of human societies: we need each other. That need is absolute. No one needs others more or less than someone else. Rather, we need each other differently. It is our systematic failure to provide for certain needs that turns some differences into debilitating conditions.
To account for our differences, we must perform and re-perform translations that feed into each other, with all their generative excesses and deficits. For all of our sakes, we need to centre universal access as a guiding principle. Then, if accident, disease, aging, or some other debilitating process makes our lives unbearable, we can freely choose death. This is how all of us can unleash our capacities and have the flourishing of bodies doing things that we deserve.
I recently saw a misleading presentation of COVID data pertaining to Israel. In this post I’m sharing several graphs that I made to counter this misleading image.
Israel is currently a popular object of those committed to an anti-vax narrative because a high proportion of the population is fully vaccinated and cases there are currently spiking. The situation is obviously concerning. However, it is being misrepresented to feed anti-vax sentiments, which are dangerous. Epidemiological study shows that widespread vaccination is key to taming the vaccine, although not in isolation.
I went to the same Israeli government data source as the original misleading table. You can find the data for these charts here. It is in Hebrew. Thank the gods for Google Translate.
The first graph presents the data in a way similar to the table. It compares the share of the cases that are vaccinated with the share of the population that is vaccinated for different age groups.
The table being circulated by anti-vaxxers presents this data in ways designed to tell a misleading narrative. First, the table left out the data for the 12-15 and 16-19 age groups, which is already telling. Second, the choice of a table makes the values seem closer together than they are. Third, and most egregious, the table creator cherry-picked data from different datasets to make the values appear closer together than they are. All the data needed for the comparison can be found in a single, downloadable Excel workbook. However, the comparison made using that data is not as alarming as the misleading data.
As seen in the first graph, the values are closer together than one would like. However, this is still a misleading way to look at the data. As the vaccinated share of the population increase, the share of cases among the vaccinated will necessarily increase. The next graph is a more common way to present the data. In fact, this data is offered in this form.
This shows the number of cases among 100,000 people within each category of unvaccinated, vaccinated, and partially vaccinated. As you can see, unvaccinated people are much more likely to become infected.
Among 12-15 year olds, unvaccinated people are 9 times more likely to be infected. The gap between unvaccinated and vaccinated people closes for the 15 to 59 age groups. It is at its lost among 20 to 29 year olds, but still unvaccinated people are contracting the virus 30% more often than fully vaccinated people.
It might seem surprising that the case rate for fully vaccinated people is higher than the rate of partially vaccinated people. However, both the closing of the gap, and the lower case rate for the partially vaccinated likely demonstrate behaviour change among the vaccinated. Vaccinated people likely began to ignore other public health measures. This is why vaccination alone, even in highly vaccinated populations, will be insufficient. Also, the sub-80% vaccination rates among more highly social 20- and 30-somethings is also insufficient. These charts show that being vaccinated does reduce the likelihood of contracting the virus, though not as effectively as we would like. However, the next chart shows were vaccines are especially important: reducing the severity of a COVID infection.
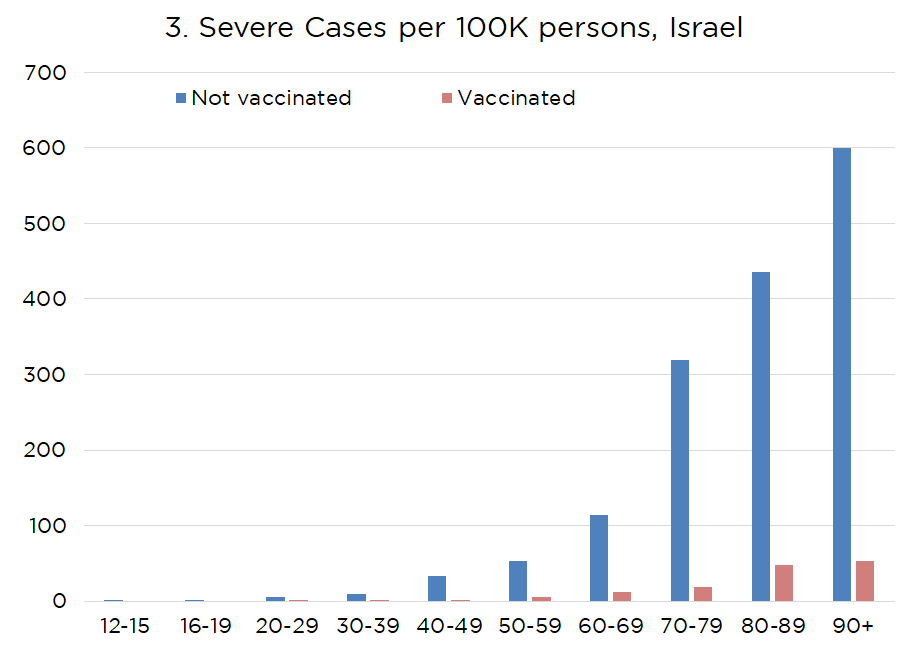
The third chart is the number of severe infections per 100,000 people within the categories of vaccinated and unvaccinated. Severe infections are much, much higher among the unvaccinated. Because the rate of severe cases among our elders is so high, it makes it hard to see the difference for younger cohorts.
Among 40-49 year olds, an unvaccinated person is 30 times more likely to have a severe case.
Another way to look at this is to consider the share of cases deemed severe. I do this in the fifth chart. The numbers show us that unvaccinated people are more likely to get infected. Further, once infected, they are more likely to have a severe case. Among those 70 and over, an unvaccinated person who catched COVID has a one-in-five chance of it being a severe case. For the vaccinated, it is less than one-in-14.
Not getting COVID obviously benefits the person who avoids the virus. However, it also benefits everyone they come into contact with. Because unvaccinated people are more likely to contract the virus, it also increases their likelihood of spreading it. This does not even account for the fact that some early research indicates that even vaccinated people that have contracted the virus are less likely to transmit it. Healthy people who can become vaccinated, but choose not to, pose a danger to those who cannot be vaccinated, such as everyone under 12. Although COVID-19 has generally been less severe for children, the delta variant has sent more young kids to hospitals.
Because unvaccinated people have a higher likelihood of a severe case they also impose a greater cost, and present a greater risk to the health care system, which endangers us all. If they require hospitalization that diverts resources. The diversion of resources is not just within health care systems. In Orlando, COVID patients require so much oxygen, it is diverting supply from the city’s water treatment plants. City officials have asked residents to reduce their water usage because supplies are running low. At high enough levels of hospitalization, severe cases can completely overwhelm hospitals. Not only does this threaten the well-being of anyone else needed hospital care, it imposes a massive physical and emotional toll on health care workers.
Conclusion
I understand being skeptical of corporate controlled science. My PhD was essentially about the deleterious effects of corporate power. Corporations have introduced all sorts of manufactured chemicals into our lives with little regard for their long-term harms. However, most of those chemicals have never undergone anything close to the scrutiny of these vaccines.
Lots of the research done to produce these vaccines did not take place within corporations whose sole purpose is improving the bottom line. University research has been key. While there is excessive corporate influence on university research, much research remains outside the drive of commercialization.
Further, epidemiologists working outside the corporate ambit are pleading with the public to get vaccinated as a key to controlling the spread of COVID-19. Epidemiology is a fascinating field that deals with complex systems. It is a well-established field with a proven track record of prediction. Epidemiological models have demonstrated again and again that high levels of vaccination will staunch the spread.
There is uncertainty about the vaccine. And there are risks. We should not deny that. However, the risks and uncertainties associated with the virus are much, much higher. For both ourselves and for our neighbours, everyone that can get vaccinated should do so, as soon as possible.
Just as importantly, we need to demand the patents on the vaccines be waived. We need global manufacture and distribution of these life-saving medicines to ramp up quickly. While our first concern should be the people of poorer countries that cannot afford the vaccines, there are also selfish reasons to want high global vaccination. The longer there are large unvaccinated populations the more epigenetic drift we will get. Epigenetic drift increases the likelihood of more dangerous variants.
If nothing else, this pandemic should have taught us that the notion of the isolated, self-sufficient individual is a myth. Our lives are all interconnected. We to be accountable to each other, and take care of each other. A care and accountability approach to the vaccine requires us to get vaccinated, if we are physically able, and to make the vaccine available to everyone as quickly as possible.
In Part 2, I looked at the shifts in U.S. household consumption that occurred during WWII. While aggregate consumption increased alongside massive government intervention, the qualitative mix of that consumption changed in some drastic ways. This analysis was intended to augment the analogy made by J.W. Mason and Mike Konczal between WWII and the prospects for a government-led post-pandemic economic boom. In this post, I will move the analogy from the U.S. to the U.K.
For several reasons, the U.K. is a better analog for our current situation.
Our ecological dire straits are much more like living adjacent to a war zone that occasionally spills over onto us than it is like living across the ocean from one.
U.S. and U.K. Economies During WWII
The economic trajectories of the WWII allies were dramatically different before the war. Although both countries had significant economic downturns in the early 1930s, the decline of the U.K. was much smaller and shorter, as seen in the figure below.
Source: U.S.: Bureau of Economic Analysis, Gross Domestic Product; U.K.: Charles Feinstein, National Income, Output and Expenditure of the United Kingdom 1855-1965
Each set of bars is the cumulative change in nominal GDP beginning in 1929. By 1933, U.S. GDP was almost 50 percent below 1929. In the U.K. the decline was about 10 percent. While the U.S. began to recover in 1934, it has not returned to its pre-Great Depression level of GDP by 1939. Meanwhile, the U.K. had almost fully recovered by 1935. In 1939, GDP was more than 25 percent higher than 1929.
With the onset of the war, both countries saw sizeable increases in GDP. As mentioned in Part 2, it took the war for the U.S. to actually complete its recovery from the Great Depression. In 1940, U.S. nominal GDP remained two percent below 1929, although it had grown ten percent from 1939. By 1941, U.S. GDP had more than recovered and was 24 percent above 1929.
The U.K.’s GDP continued to outpace the U.S. during the early years of the war (see the next figure). This was entirely driven by government. By 1941, U.K. nominal household consumption was 12 percent above 1939, while for the U.S. it was 21 percent higher. Then, in 1942, U.S. GDP growth overtook the U.K. as its consumer expenditure continued to grow more and government expenditure jumped dramatically.
Source: U.S.: Bureau of Economic Analysis, Gross Domestic Product; U.K.: Charles Feinstein, National Income, Output and Expenditure of the United Kingdom 1855-1965.
During the war years, government expenditure became a much larger portion of both countries’ GDP, as seen in the next figure.
Although it is universally known among economists that government spending is a part of GDP, they generally neglect that fact when advocating for increased GDP as evidence of increased well-being. Belief in ‘crowding out’, which I discussed in Part 1, could be a reason why. Or, perhaps ‘crowding out’ offers a convenient theoretical justification for an ideological opposition to government.
Currently available data does not have values for U.K. government investment during the war years. Aggregate investment in “fixed capital formation” is available. However, comparisons between the U.S. and the U.K. suggest there may be accounting differences that affect the distribution of values between expenditure and investment. For the figure below, I imputed a value for U.K. government spending on assets using the U.S. government’s relative share of total investment in non-residential assets. Before and after the war, the government share of total investment was similar for the U.K. and the U.S., even if the investment share of GDP was quite different.
In the figure below, the full height of the black/gray bars is U.K. government spending on both consumption expenditures and investment, as a share of GDP. The investment segment is in gray. The red/pink bars are U.S. government spending. The pink segment is the spending categorized as investment. If there are accounting differences, then the two categories are not as meaningful as the total amount.
Source: U.S.: Bureau of Economic Analysis, Gross Domestic Product; U.K.: Charles Feinstein, National Income, Output and Expenditure of the United Kingdom 1855-1965; NOTE: Lighter coloured segments are ‘investment’. U.K. government investment is imputed from the U.S. government share of total U.S. non-residential investment.
In 1940, total U.K. government spending was already more than 40 percent of GDP. For 1942 until 1944, it was over 50 percent. Because the U.S. did not enter the war until 1941, the level of government spending as a share of GDP actually fell slightly in 1940. Nominal government spending increased, but because GDP increased more, the share fell.
U.S. government spending never broke the 50 percent mark, although it came close. Obviously, the U.K. and U.S. governments comprised so much economic activity because of the all-out war effort. Both governments were commanding enormous amounts of material and labour to equip and conduct the war.
U.S. national accounts have data on defence spending. In 1939, U.S. defence spending was $1.7 billion. In 1944, it was $97 billion! In 1941, the U.S. spent $15 billion on defence, which was more than the total amount spent from 1929 to 1939.
So, both the U.K. and the U.S. had growing economies, as measured by nominal GDP, with a substantial portion of that growth in the form of increased government spending. Importantly, that spending becomes some people’s income. The economist J.M. Keynes recognized this fiscal reality—a fact ignored, denied, or misunderstood by most of our prominent contemporary economists—and saw in it both opportunity and risk. The spending offered an opportunity to reduce inequality. The risk was that the money spent to fund the war effort could lead to destructive inflation, especially of goods needed to conduct the war.
Keynes offered his solution in a short pamphlet titled How to Pay for the War. He called for a mixture of taxes and forced saving, which would draw money out of circulation. I will discuss Keynes’ solution and its applicability to our present situation in the conclusion to this third, and final, part. However, for now it suffices to say that the U.S. and the U.K. were affected very differently by the war, not least in the domain of household consumption. These differences are important if we are going to look back at WWII as an analogy for dealing with the post-pandemic recovery in the context of the climate crisis.
U.K. Household Consumption
The inspiration for this series of posts was a pair of articles; one written by Peter Coy, the other by J.W. Mason and Mike Konczal. The latter made the point that price-adjusted U.S. household consumption rose throughout WWII, even as the U.S. government spent heavily. This inspired Coy to check the fact and determine that Mason and Konczal were correct. However, the situation was markedly different in the U.K.
Source: U.S.: Bureau of Economic Analysis, Real Personal Consumption Expenditures by Type of Product, Quantity Indexes; U.K.: Charles Feinstein, National Income, Output and Expenditure of the United Kingdom 1855-1965. Values are the percentage change relative to 1939.
Consumption by U.K. households fell every year for the first four years of the war. Although it increased in 1944 and 1945, it would not fully recover until 1946. As we will see below, even in 1946 many categories of household consumption remained well below their pre-war levels.
Unlike the U.S. economy, the U.K. economy was unable to provide simultaneously more goods and services tohouseholds and the war effort.
Changes in U.K. Household Consumption
Unfortunately, the detail available in U.S. national accounting is not available for the U.K. And the disaggregate categories are not the same as the U.S. data. That means I cannot directly compare shifts in household purchases of durable goods, non-durable goods, and services. Nonetheless, the disaggregated data highlights some important qualitative shifts in household consumption that accompanied the aggregate decline.
‘Essential’ Goods
First, the data shows that the war required a decline in several categories of goods that we can consider ‘essential’: fuel & lighting, food, and clothing.
Charles Feinstein, National Income, Output and Expenditure of the United Kingdom 1855-1965.
Food consumption fell by 21 percent. It is worth noting that in 1943 almost 20 percent of the working-age population was in the armed forces. That means a significant portion of food consumption would have shifted from a household expense to a government expense.
Additionally, we know about the ‘Victory Gardens‘, which produced food for consumption but was excluded from the national accounts. This points at a standard criticism of GDP: it only includes most activities once they are monetized, which excludes a lot of activities that are nonetheless valuable. The classic example is the exclusion of housework, which is heavily performed by women. If a stay-at-home mother cares for her children and cleans her home, it contributes nothing to the national accounts. However, if she goes back to work, and hires a nanny and house cleaner to perform those tasks, that expense is added to GDP.
The reduction of fuel & light likely meant, on the one hand, more discomfort due to cooler homes in winter, and more inconvenience from reduced lighting. On the other hand, it also meant more diligent conservation, which can offer its own rewards. Anyone who has We cannot assume that a reduction in household purchases automatically means deprivation.
Similarly, the reduced spending on clothing likely brought disappointment to many. Those who enjoy wearing the latest fashions undoubtedly had to forego that luxury. However, it also meant people got more use out of their clothing by wearing it for longer. Additionally, as with food, a large portion of the population were provided a portion of their clothing by the government.
The two figure above—aggregate consumption and consumption of ‘essentials’—both overstate how much consumption by the U.K. population actually declined. At the same time, figures of aggregate U.S. household consumption understate how much consumption by the U.S. population actually increased. A similar portion of the U.S. working age population ended up in the armed forces during WWII, although, as noted in Part 2, “food furnished to employees (including military)” is a subcategory of household consumption in U.S. national accounts.
Other Goods & Services
In the U.K. data, five categories of goods are combined into a single annual value during the war years. It includes several types of goods that saw declines in the U.S., such as furniture. The aggregated category saw a 44 percent decline. Vehicle purchases dropped to nothing in 1943 and 1944. Expenditures on vehicle operations declined by 78 percent. A broad category of ‘other services’ fell by nine percent.
In fact, other than housing, which had a minor increase, only two categories of U.K. household consumption expenditure increased between 1939 and 1943: tobacco and public travel & communication.
Charles Feinstein, National Income, Output and Expenditure of the United Kingdom 1855-1965.
These two categories correspond to some highlighted in my analysis of shifts in U.S. household consumption during the war. I discussed how increased consumption is not necessarily a sign that people are better off. Tobacco is the perfect example. While smoking can be an enjoyable activity, it is also physically harmful and addictive. Also, consumption is exacerbated by stress. In actual pounds, tobacco expenditure rose as high as 8.9 percent of total household expenditures during the war.
However, the increase in public travel & communication was mostly a good thing. People were connecting with friends and family more. It is likely a healthier way to manage stress. This greater connection was part-and-parcel of the social cohesion and solidarity that those who lived through the war described as a highlight among all the stress and terror.
Post-war Household Consumption
By 1946, aggregate U.K. household price-adjusted purchases exceeded the pre-war level. However, several categories of goods remained much lower. For the following, I am comparing 1946 to 1938. That allows me to compare some of the categories that were combined during the war years. It also accounts for the fact that some categories of consumption had already declined by 1939.
First, it is worth noting that a comparison with 1938 shows that the purchase of books, which is not reported for the war years, was 46 percent higher in 1946 (not shown). Perhaps this is due to a dramatic recovery from wartime decline. Paper use was restricted during the war. However, U.K. consumers may have paralleled U.S. consumers, who bought more books during the war, as seen in Part 2.
Charles Feinstein, National Income, Output and Expenditure of the United Kingdom 1855-1965.
The categories that were higher in 1946 than 1938, apart from tobacco, public travel & communications, and books, included food and fuel & light. However, clothing remained 21 percent below 1938. All the categories that might be considered ‘durable goods’ remained well below pre-war levels. Household purchases of vehicles would not achieve pre-war levels until the early 1950s. The same was true of furniture and household appliances.
Conclusion
The sacrifice of U.K. households during wartime is the less surprising outcome compared to the increased household consumption in the U.S. The latter might hold out a promise that we can recover from the pandemic and confront the climate crisis and not sacrifice our well-being. However, we also need to be prepared to give up some things. The mix of things we purchase is going to change.
Consumption?
We need to acknowledge that an aggregate measure of household consumption is an extremely problematic indicator of well-being, for many reasons. First, there is the issue of distribution. All measures examined in this analysis were for consumption by the entire population. If consumption at the top of the income/wealth hierarchy grows by more than it falls at the bottom, then aggregate consumption would increase.
Second, increased consumption of certain goods and services does not necessarily mean we are actually better off. If we are consuming more of certain ‘bads’ in order to manage stress or other disorders, that is hardly evidence we are better off. Additionally, if households are increasing their spending on goods and services that would be more effectively, efficiently, and fairly distributed via public institutions, that is not necessarily evidence of improved well-being.
Third, the concept of ‘consumption’ is itself problematic, as David Graeber, among others, has written. The issue was touched on above, in a different context: government consumption vs. investment. As mentioned, the U.S. and U.K. data seems to differ in terms of how government purchases were classified as either ‘consumption’ or ‘investment’. The dividing line is hardly clear-cut.
We never think of household purchases as an investment unless it is for a business, at which point the buyer ceases to be considered a household, although even this categorical distinction is not as clear-cut at the margins. Household purchases, sometimes labelled “final consumption expenditures” because they are considered the endpoint of our economy, do not become assets that generate income. Yet, as Graeber notes, much of what we buy is not actually ‘consumed’.
When a teenager buys a guitar and begins to learn to play, that is more an investment than consumption. This is obviously true if the teenager goes on to become a paid musician. However, it is also true if it just contributes to building the skills of a lifelong hobby that is never monetized. While the concept of durable goods somewhat compensates, using the term ‘consumption’ to describe the relationship between the household and those goods is misleading.
Finally, focus on increased ‘consumption’ means that more purchases of ‘goods’ is axiomatically better, even if these increases are due to faster obsolescence or break-down. As our household objects become more complicated, we lose our ability to repair them, either ourselves or through the service of a local repairperson. The sellers of these goods have little interest in making them more durable or more easily repaired. Quite the opposite.
Much of the obsolecense of durable household goods diverts resources from sytems of production into waste sinks. Increased ‘consumption’ of durable goods is likely making us worse-off in the long-run.
Constrained Planning and Plenty
Mason and Konczal analogy is important and useful to combat mounting calls for austerity. But there is an extended debate to be had about how we use our resources. The post-pandemic recovery offers an opportunity to begin doing what needs to be done to manage our multiple ecological crises.
Government spent heavily during the pandemic to support economies and households when other sources of income disappeared. Taxes did not rise to match that spending, so the amount of money in the economy increased. Many of our usual spending outlets, such as restaurants and entertainment, were greatly reduced. This led to record household savings rates in many countries.
It also has economists anticipating a major boom in household spending as pandemic restrictions are lifted. While it is a hopeful sign in terms of creating jobs, it is worrisome in terms of the potential ecological impact. What are we going to ‘consume’? How disposable will those things be?
The pandemic is a reminder of the need for government to participate in economic management during times of crisis. It was a lesson learned intensively during WWII. Yet, almost everyone in government, as well as media, is ignoring the lesson as we stumble along, trying to do as little as possible to deal with the climate crisis.
Keynes recognized that spending on WWII would add money to the economy, but that this was a mixed blessing. While it would ensure continued income for workers, increased spending power meant they would compete for resources needed to fight the war. We face a similar problem now, even if our leaders have failed to recognize the necessity to spend huge. Just as Keynes recommended, we will likely need a combination of taxes and forced savings.
We need material budgeting, as was done during WWII. What materials are available? What is needed for a just transition? What is left over? We cannot expect markets and prices to achieve a sustainable outcome.
The qualitative mix of goods and services will change, as it did in the U.S. and the U.K. during WWII. Our absolute consumption of material goods will likely also decline. At the very least, just as fighting the war was prioritized when distributing resources, achieving a just transition must be prioritized. However, this need not mean absolute deprivation. We need to plan our economies within the material constraints of the Earth, but th
At the very least, we can likely have more leisure time. We can also have more public provision. Even in our sacrifices, we can find pleasure, knowing that we are doing so as part of ensuring a just, sustainable future for humanity. Key to appreciation of sacrifice is that it be shared. That is why Keynes thought the economic management needed to fight WWII offered an opportunity to reduce inequality. We should grab the same opportunity that exists now.
After WWII, many economies had significant, sustained booms. Unfortunately, those booms had ecological consequences, many of which we are only acknowledging now. Further, many of those ecological consequences were borne by marginalized communities, especially Indigenous peoples who were displaced by extraction. We cannot have the same sort of boom following a just transition.
We will need continued management of many resources and that management must include the people most affected by extraction and disposal. However, that does not mean we cannot have richer, more satisfying lives, with plenty of consumptive opportunities within those constraints. While our material resources have opportunity costs—using rare earth minerals for an MRI machine means those minerals are not available as inputs to iPhones—they can be combined and recombined with emergent effects that serve ‘consumers’ in vastly different ways. While our resources are constrained, their potential becomings are infinite. We must acknowledge constraints while denying scarcity.
We need to supercede the naive—and destructive—individualism of both mainstream economic theory and American right-wing populist rhetoric. Our lives are lived within many commons. We can acknowledge our intractable interdependence without denying the individual, whose individuality is both output and input of the different publics in which they participate. The Earth is materially fixed. But that materiality can express itself as both a wasteland devoid of life or a thriving cornucopia of ecological and cultural diversity.
Getting from here to there will require much effort, including the sacrifice of things that many of us currently take for granted. Thankfully, we have the resources, expertise, and creative capacity to not only do it, but to do it joyfully.
In Part 1, I explained the motivation for this series.
I want to use the analogy of WWII, as invoked by economists JW Mason and Mike Konczal in an NYT op-ed, to consider how we ought to manage a potential post-pandemic economic boom. In this post, I will look at the qualitative transformations that took place in U.S. household consumption during WWII. These transformations occurred, in part, because of government control of material resources.
While the aggregate level of household consumption only fell for a single year—1942—the mix of goods and services shifted dramatically, and some categories of consumption dropped for several years. The best known example are private automobiles. The productive capacity, and material inputs, of the automaking industry were turned over to wartime production and the sale of new automobiles dropped to just over one percent its 1941 high-water mark.
At this point, it is worth noting that when WWII began, U.S. consumption had not yet recovered from the Great Depression. Nominal sales of new automobiles in 1941 were barely half a percent higher than they had been in 1929. In 1940, nominal consumption was still almost 10 percent lower than 1929, while the population was almost nine percent higher.
It is widely recognized that although the New Deal helped to support people suffering through the Great Depression, it was insufficient for kickstarting the U.S. economy. It took WWII to get production back on track. That is an important lesson for those of us that advocate a Green New Deal.
What we actually need is a Green WWII, although perhaps a wartime metaphor is not ideal for the collective, cooperative global effort required. For more on the WWII analogy for achieving a just transition, see Seth Klein’s book A Good War, which describes how Canada’s economy was reshaped for the war effort. Klein argues that a just transition requires a similar scope and scale of transformation.
The chart below shows the change in U.S. household consumption of goods and services from 1941 to 1944.
Source: Bureau of Economic Analysis, Real Personal Consumption Expenditures by Type of Product, Quantity Indexes
Goods and services are the two broadest categories of consumption in the U.S. national accounts. While the purchase of services increased by 20 percent, goods purchased fell by 8 percent.
Goods are further disaggregated into 1) durable, and 2) non-durable. Services are disaggregated into 1) household expenditures on services, and 2) expenditures on services of non-profits serving households. Each of the categories, except the last, have at least two more levels of disaggregation.
The fall in goods consumption was entirely a fall in the purchase of durable goods, as seen in the next figure.
Source: Bureau of Economic Analysis, Real Personal Consumption Expenditures by Type of Product, Quantity Indexes
In aggregate, the purchase of non-durable goods increased modestly, while certain sub-categories fell. The purchase of durable goods fell every single year from 1941 to 1944. It had fully recovered by 1946.
Durable Goods
As already noted, a large portion of the decline in durable goods was automobiles, which were about one-quarter of all durable goods purchased in 1941. Household appliance purchases fell by 89 percent. Two other categories that saw declines of more than 50 percent were audio and photographic equipment, and musical equipment. Notably, the purchase of books increased by almost 60 percent!
Source: Bureau of Economic Analysis, Real Personal Consumption Expenditures by Type of Product, Quantity Indexes
The chart above also shows that in 1944 the purchase of ‘Jewelry and Watches’ was 28 percent higher than in 1941. This understates just how much these purchases increased during the war, since they fell slightly in 1944.
I used data on the purchase of ‘Jewelry and Watches’ as part of the research and analysis for my dissertation, which was about the De Beers diamond cartel during WWII. I argued that the increase in purchases was evidence of the company’s success in conjoining diamonds with engagement. However, the war was a vital context.
At a time when Americans were foregoing luxuries, such as automobiles, appliances, cameras, and radios, they dramatically increased their purchase of jewelry, perhaps the most luxurious of luxuries. Why? During WWII the number of U.S. marriages increased dramatically. Men and women were getting engaged and married before the men went overseas. This led to a dramatic increase in the sale of diamonds rings. For more on this, you can read the dissertation, or read the presentation I gave at my doctoral defence, or watch this video of a presentation from early in my research and analysis.
The reasons for consumption changes are always many. I suspect that multiple dissertations could be written about every category of household consumption expenditure.
The fall in durable goods was not because the population could not afford them. It was because the materials needed to produce many of them were diverted to the war effort. Obviously the steel needed for private automobiles was required for military transportation and weaponry. It also required large amounts of optical materials, rubber, fine copper wire, and much more. This left much less of these essential inputs available to provide durable goods to households.
Non-durable Goods
For non-durable goods, almost every sub-category saw an increase, except those associated with automobiles and those associated with recreational activities.
Source: Bureau of Economic Analysis, Real Personal Consumption Expenditures by Type of Product, Quantity Indexes
However, an examination of the categories raises an important question about the meaning of consumption.
Economists and policy-makers take for granted that greater consumption means greater well-being. Of course, they will acknowledge that the reality is messier than this. But that acknowledgement does little to alter the reflexive use of national accounting measures as measures of well-being. Indeed, many of the goods and services we consume are a response to a harm.
Three of the categories of goods—alcohol, tobacco, pharmaceuticals—are at least partially coping mechanisms. The war was a stressful time. Almost everyone would have known someone serving overseas; most would have known someone who was killed. In the early years, when Germany, Italy, and Japan were swiftly claiming territories, there was incredible uncertainty about the war’s outcome. Understandably, people would have medicated that stress.
Examination of the make-up of household consumption in post-war years hammers home that increased expenditure need not mean greater well-being.
In nominal terms, total personal consumption expenditure has grown at an annualized rate of 6.5 percent per year. Certain categories have grown much more and now comprise a much larger share of people’s spending. The relationship between greater spending on these items and well-being is ambiguous, to say the least.
Source: Bureau of Economic Analysis, Personal Consumption Expenditures
The above shows five categories of spending that have variable relationships with well-being. For example, greater spending on doctors is partially about greater access to more and better kinds of treatment. However, it is also about more maladies. The same is true of ambulances and hospital fees. A greater share being spent on nursing homes is partially about longer life spans. But it is also about less intra-family care for our elders, which has mixed consequences. Greater shares spent on financial services is partially about more people having wealth that needs to be managed, but also about the wealthy spending more to manage wealth in ways that avoid taxes.
Beyond the above contradictions, the majority of medical services should not be paid for by individuals. They should be free at the point-of-service, and funded by the government as a public good. The fact that hospitals now comprise eight percent of American consumer spending is outrageous when combined with the scale of medical debt. Medical care should be a right, not a growing expense. And increased household consumption that includes increased spending on medical care cannot unambiguously be claimed to express greater well-being.
Services
As with non-durable goods, almost every sub-category, other than those associated with automobiles and recreational activities, saw an increase in consumption.
The largest increase was in the category of “food furnished to employees (including military)”. This is the only category where the military build up had obviously bled over into the data for household consumption. In 1939, it was less than one percent of all service spending. By 1945, it was 5.3 percent. However, that misleading boost to personal consumption expenditure is not sufficient to change the overall image that Mason and Konczal deploy.
Source: Bureau of Economic Analysis, Real Personal Consumption Expenditures by Type of Product, Quantity Indexes
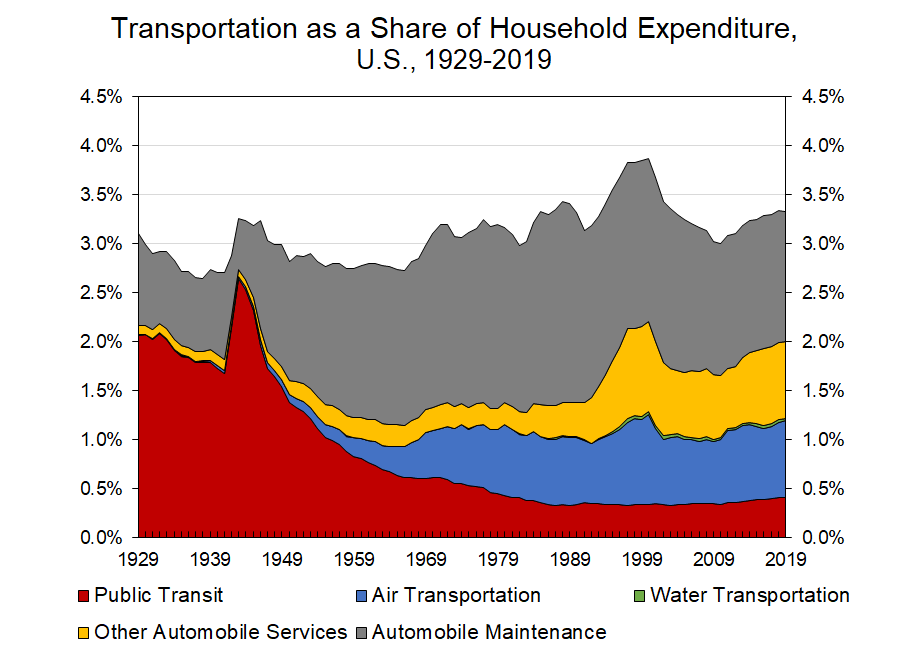
Because fuel costs had risen, and fewer cars were being purchased, there was much more use of public transit. In fact, this would be a high for public ground transportation (as a share of total consumption) for as long as the U.S. has kept national accounts. In 1943, public ground transportation was over 80 percent of all transportation services, which includes automobile service and repair. By 2019, it was barely 12 percent, having been displaced by automobile service and air travel.
Source: Bureau of Economic Analysis, Personal Consumption Expenditures
When we look at the increases in the purchase of services, we see that people were eating out more and they were communicating more. Both largely express positives for people’s well-being. However, the large increase in gambling is less ambiguously good. While gambling is benign entertainment for many, it is also a problematic, even destructive, habit for others.
Perhaps the most interesting increase is in the purchase of social and/or religious services. On the one hand, this could be another expression of the undercurrent of anxiety that comes with living in wartime. On the other hand, much of the spending on these kinds of services is not for oneself; it is charitable spending.
In my research on De Beers, one of the things that jumped out from first person descriptions of life in the United States during WWII was the feeling of unity. The government very deliberately sought to create this sentiment. It wanted the entire population to feel like they were part of the war effort, even if they were not on the frontline.
In The Good War, Seth Klein writes about the Canadian government’s effort at creating public unity. It reflected on the experience of the First World War and a perceived lack of unity that hampered the war effort. Part of the failure came from a widespread sense that the burden of the war was disproportionately falling on the working class. That was part of the motive for extremely high top marginal income tax rates, and excess profits taxes.
We can debate how fairly the costs of the war were actually distributed. We debate how inclusive U.S. and Canadian societies actually became. Racial and ethnic divisions certainly did not disappear. However, many reported feeling a greater sense of solidarity. In such a setting, people likely felt feel giving.
One of the few services that did decline during the war was household maintenance, which fell by 13 percent. Conversely, purchases of tools were among the few durable goods with a stable level of expenditure. This suggests that people substituted their own labour for the the purchase of repair services. All other things being equal, this would have reduced GDP, since expenditure of our own labour is not included in national accounts, while spending for third-party labour is.
Take-aways
In Mason and Konczal’s op-ed, they mobilized the fact that price-adusted personal consumption expenditures in the U.S. continued to rise, except for 1942, even though the government massively intervened in the economy. They used the fact to argue that government can and should spend to support a post-pandemic boom. I concur with this assessment. However, I want to call attention to the qualitative shifts that occurred in consumption patterns. Aggregate consumption—a very problematic measure when adjusted for price-changes—might have continued to increase, but there were substantial differences across the categories of household consumption.
The end of the pandemic is likely to reinvigorate household consumption. Since the climate crisis continues, we must acknowledge both the necessity and the possibility of qualitative transformation. During WWII, public transportation, as a share of personal consumption expenditure, jumped by more than one percentage point. At the same time, purchases of private automobiles collapsed. The purchase of goods to service private automobiles also dropped significantly.
While there were undoubtedly certain hardships associated with this collapse, it was necessary for the war effort. For similar—and additional—reasons we need to confront the likelihood that current private automobile ownership must be drastically reduced. However, this does not have to mean that we are necessarily worse off. This will be discussed more in the conclusion to Part 3.
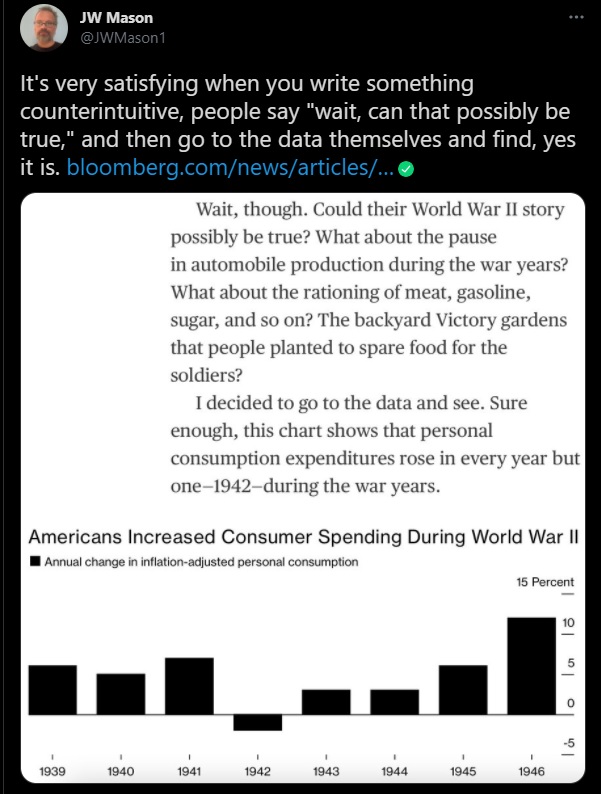
Economist JW Mason recently tweeted the following:
Bloomberg writer Peter Coy was motived to perform this research by an NYT op-ed from Mason and Mike Konczal. Mason and Konczal’s primary argument is that we can have a post-pandemic economic boom, but that it needs to be properly managed. They are trying to pre-empt the hand-wringing about ‘over-heating’ the economy and creating runaway inflation. Mason and Konczal point to the experience of WWII, when U.S. household consumption increased even as large amounts of labour and material resources were diverted to the war effort.
Coy was able to affirm the evidentiary basis of Mason and Konczal analogy between the present era and WWII-era production.
The pair argue that the demand driven by military need led to increased supply capacity. Importantly, that increased capacity benefited the broader populace, hence the increased household consumption. Although Coy is receptive, he tempers their argument, citing an article by economist Price Fishman, who argued that the national accounting data “does not account for the declines in quality of goods, the extra costs of obtaining rationed goods, and the complete absence of other goods.”
Fishman is opening a huge can of worms. The construction of “price-adjusted” or “inflation-adjusted” measures of output—called “real” measures in many national accounts—is extremely fraught, not least because of changes in quality, and changes in the qualitative mix of goods and services. Fishman suggests that “better estimates of the true prices” of consumer goods and services show that individuals consumed less during the war years.
This notion of “true prices” is downright ridiculous. It exposes economists’ lack of ontological thinking, their worship of the price mechanism as something that could express the true value of a good or service, and their confidence that economists trained in equilibrium thinking know how nominal prices should be adjusted to express real value.
There are better and worse prices, but there are no true prices. Better and worse is an inherently normative assessment, while economists consider themselves predominantly positive analysts of the economy as it is.
Fishman is privileging other estimates that are still just estimates, while infusing them with a veneer of objectivity. Economists constructing the estimates preferred by Fishman must make numerous assumptions to justify whatever adjustments are being made to actual, recorded prices. This is true of the reported “real” figures and the ones that support Fishman’s argument.
Nominal prices, the one that consumers actually paid, the ones that informed input and output choices, the ones that are supposedly clearing markets by balancing supply and demand, are deemed unsuitable by those whom Fishman claims are creating “better estimates of the true prices”. For all their valorization of “the market”, economists frequently grant themselves the soothsaying ability to understand what a price ought to be.
Rather, I want to examine the WWII analogy to develop more insights on proper management of a post-pandemic economic boom. Greater management is necessary if we do not want a post-pandemic boom to pour fuel onto the fire of the climate crisis, as well as numerous other ecological crises.
Mason and Konczal’s op-ed offers not one word on our our multiple ecological crises. On the one hand, Mason and Konczal can be forgiven, since they are fending off a more immediate threat, in the form of rising austerity rhetoric, and they are writing in the limited space of an op-ed. On the other hand, economists writing about macroeconomic matters need to adopt the habit of always situating the economy within the environment.
Current levels of production are already unsustainable in terms of resource use. Increases in productive output have always had commensurate increases in material inputs and waste production. A boom risks worsening the situation.
Somehow the same people who lectured us that “there’s no such thing as a free lunch” also told us that we could have indefinite economic growth. The latter message has been useful for obfuscating how environmentally destructive “growth” has been. However, it is the former message that has economists of the Larry Summers ilk adopting the latest version of their condescending “I know you don’t want to hear this but” tone and lecturing us that governments must rein in spending… or else.
Their story is that government spending crowds out investment by the private sector. It is private sector investment, we are told, that makes endless growth possible. While they will give a nod to Keynes, and admit a role for government to smooth out the vicissitudes of the market, they remain market evangelists, preaching the good word of competition, profit maximization, and the price mechanism.
Mason and Konczal reject this story. Although they do not discuss our ecological crises, dealing with these crises will be much more difficult if the austerians win the argument.
Coy notes that private sector investment did fall during the war. However, to claim “crowding out” as the reason requires heroic assumptions disconnected from reality. The concept of crowding out assumes that if the public sector had not spent this money, then the money would have been available to the private sector, which would have used those funds in other productive ways. Not only is this fiscally and financially illiterate, it demonstrates a lack of understanding of industrial investment.
It was wartime. There was incredible uncertainty. Memories of depressed household demand and persistent stagnation were palpable. Of course business pulled back its own investment. Not only did the government not crowd out the private sector, investment by the latter would likely have fallen more if the government had not spent as it did.
The analogy with WWII is important for both our economic recovery from the pandemic and the economic transformation needed to deal with on-going ecological crisis. At the same time, the analogy has limits, although these too are illuminating. Not least, we cannot treat quantitative increases in household consumption as unambiguously good. In parts 2 and 3, I will develop the analogy with WWII further, and see what else it can tell us, and where it falls short.
Part 2 will look at the qualitative shifts in U.S. household consumption that took place during the war. Part 3 will move from the U.S. as the analogic country to the U.K. While the bulk of both Parts 1 and 2 is heavily empirical—perhaps mind-numbing so—the conclusion is much more speculative.
I argue that our ecological crises requires planning if our economies are to function within the Earth’s material constraints. However, this does not mean we must deprive ourselves and live lives of meagre subsistence. Far from it.
“On the economic front we lack not material resources but lucidity and courage.”
Those words are found in a 1940 pamphlet titled How to Pay for the War, written by pioneering economist John Maynard Keynes. Sadly, they apply to current discussions about the economics of the climate emergency. In fact, we are further behind in talks about an even greater threat than the U.K. was in 1940.
Keynes took for granted widespread acceptance that government spending would dramatically increase to wage war. Unfortunately, we have not yet accepted that governments will need to spend huge amounts of money to achieve a just transition to a green economy. That makes it much more difficult to answer the question of how to pay for it.
I was made aware that too many have their heads in the sand during a recent, frustrating appearance before the House of Commons Standing Committee on Industry, Science and Technology, where I was invited as a representative of Canadians for Tax Fairness to speak about economic recovery from the COVID-19 pandemic.
Importantly, every witness spoke about recovery in the context of the climate emergency. However, the discussion failed to address the massive elephant in the room: the inadequacy of the federal government’s response given the scale and scope of the crisis.
Consider the scale of the problem. Canada recently announced an updated target of reducing emissions by 40-45 per cent by 2030 relative to 2005 levels. But it still has no plan to get all the way there, and the latest figures show that emissions actually rose between 2017 and 2019. Further, the current target, which we are failing to meet, is considered inadequate by the International Panel on Climate Change, if the globe is to limit warming to 1.5 C.
Consider the scope of the problem. We know we need to retrofit our buildings, transform our transportation infrastructure, and rapidly reduce, eliminate, or innovate high-emission industries. But these sectors span a wide range of companies, and are too slow-moving to meet the urgent need for change. There is much expert knowledge capable of telling us how to do what needs to be done, but we need coordinated mobilization and support of that expertise.
At the same time, we need to protect people from the myriad, mounting harms of climate change, harms that risk being compounded by the necessary transformations of our energy systems. Jobs will disappear. Some goods and services will become more expensive or unavailable. People should not struggle because decades of overly cheap fossil fuels have malformed our economy.
The problem is massive and complicated.
In response to the pandemic, the federal government spent unprecedented amounts of money. Inexplicably, they are not doing the same to fund a proper response to the climate emergency.
Although the government of Prime Minister Justin Trudeau is the first in two generations to increase federal expenditures as a share of GDP, planned program spending is lower than under former prime minister Brian Mulroney. This is exemplary of what Seth Klein, author of A Good War: Mobilizing for the Climate Emergency, calls “the new climate denialism.”
The long decline in federal expenditures has been justified by belief in the free market. Profit-driven competition was supposed to deliver efficiency and innovation. Government was to be as limited as possible.
But we cannot compete our way out of the climate emergency. First, there is too much uncertainty about potential profits to entice companies to do what is necessary. Second, research and development need to be cooperative, and successful inventions shared widely. Finally, much of the work to be done, such as ecological rehabilitation, has no source of revenue, let alone profit.
The federal government must do as it did during World War II and spend whatever it takes to make the necessary economic change.
Keynes’ plan to pay for the war was designed to ensure the greatest availability of resources for the war effort. However, it was also intended to reduce inequality and to maintain economic stability through low inflation. Similar motives ought to be part of our climate plan.
Money spent by government to transition our economy becomes someone’s income. That may drive demand for certain goods and services beyond supply capacity, leading to inflation. Households may compete with government for goods needed in the climate fight. To lessen those pressures, governments can use progressive taxation.
More importantly, taxes are necessary to reduce the unearned increase in wealth at the top of our economic hierarchy. We have a trickle-up economy. As the money spent by the government circulates, portions are diverted as profit and interest, which accrue with asset owners.
Asset ownership is highly unequal, so the rich get richer, just because they are already rich. That wealth is a source of power, giving the rich excessive influence over government, which is part of the reason the current climate response is so anemic.
Taxes reduce inflationary concerns and inequality, while providing revenue for the ongoing climate crisis mitigation and economic transformation.
The crisis is huge. More spending and more taxes are unavoidable if Canada is to achieve the scale of coordinated effort required for a just transition.
In Janet Yellen’s confirmation speech to United States Senators in January 2021, she said the government must “act big” to deal with the pandemic’s economic fallout.
Three months into her role as the first woman treasury secretary, Yellen is going beyond big spending with an ambitious plan to rollback decades of corporate tax cutting.
Canada’s Liberal government must grab the same opportunity to go as big, if not bigger.
Just like Yellen, Finance Minister Chrystia Freeland is the first woman to hold the federal government’s most important fiscal position.
With her first budget since taking on the job mid-pandemic, Freeland has an opportunity to be remembered as a pathbreaking finance minister. She can take plenty of inspiration from Yellen’s “Made in America Tax Plan.”
Yellen’s call for a 21 percent global minimum corporate tax, and an increase to the US federal corporate tax rate back to 28 percent attracted the most attention. Canada should support these measures as part of ending the decades-long race to the bottom on corporate taxes. A recent study showed Canada would gain at least $11 billion by supporting the global minimum.
However, Yellen’s plan calls for much more. Let us consider three components that the Canadian government could emulate.
First, the federal government needs to close the gap between profits reported to shareholders and profits reported to tax authorities. The US government plans to impose a 15 percent tax on the excess between ‘book income’ and ‘taxable income.’
In 2019, at least 25 Canadian corporations with book income greater than $100 million paid no net income tax. With a 15 percent minimum book income tax, those companies would have paid a combined $5.1 billion. Instead, they claimed almost $4 billion in net tax deductions.
A minimum tax on book income reduces the incentive for fancy accounting to reduce taxable income, including through international profit shifting.
Second, Canada should shift tax subsidies from fossil fuels to clean energy production. The Biden administration’s plan includes a range of supports to guide the US transition toward a carbon-neutral economy. At the same time, it will remove existing subsidies for fossil fuel companies, and increase ‘polluter pays’ tax penalties.
Despite decades of federal and provincial support for fossil fuel companies, the industry is waning. Since the industry’s peak in 2014, employment had fallen almost 20 percent before the pandemic. Over that same time frame, fossil fuel companies claimed $12.4 billion in various tax reductions, including more than $800 million worth of investment tax credits.
The pandemic has wreaked havoc on employment. The federal government should use this opportunity to aggressively reshape the country’s energy industry.
Yellen’s Treasury Department recognizes that support for clean energy production will attract investment. More investment can create higher-paying jobs to replace those being lost in oil and gas.
Third, the Trudeau government should invest in more tax enforcement. Since 2015, the federal government has increased funding for the Canada Revenue Agency. Yet, the CRA’s spending on international and large business compliance was actually reduced from 2015/16 to 2018/19. Planned spending for all reporting compliance in 2021 remains more than 10 percent below its 2008 level.
The Parliamentary Budget Office estimated that each additional dollar spent on business tax compliance returns about five dollars in fiscal benefit. More robust enforcement would both discourage law-bending tax schemes and hold corporations accountable when they do underpay.
Decades of corporate tax cutting failed to produce the benefits promised by proponents. Instead, it has contributed to worsening wealth inequality, which is implicated in myriad social harms.
The IMF recently said governments need to use every measure at their disposal to recover from the pandemic in a way that reduces inequality. Combine that with the findings of a PBO report on tax avoidance that concluded “it may be time for a ‘fundamental rethink’ on international corporate taxation.”
The finance minister, as author of a book called Plutocrats, knows that inequality is the product of political choices as much as economic forces.
The Biden administration is offering an unprecedented opportunity for Freeland to join an international effort and make bold political choices. The ball is in Canada’s court.
D.T. Cochrane is an economist and policy researcher with Canadians for Tax Fairness. D.T. has lived in Ontario for more than 20 years, but still considers himself a Saskatchewanian at heart.
The recent RCMP incursion into Wet’suwet’en territory was aimed at enforcing an injunction. Coastal GasLink was awarded the injunction against Wet’suwet’en land defenders who were blocking construction of its pipeline.
Injunctions have long been an important part of “business as usual” for corporations that operate on Indigenous lands. But are they still a useful tool for protecting corporate assets?
Despite the injunction against the Tyendinaga Mohawk, the blockade remains in place. Mohawk lawyer Stephen John Ford says the blockade is not in violation of the injunction.
The refusal to comply with court injunctions, and the use of legal expertise to fight them, pose major challenges for Canadian businesses.
Several other blockades have not been served with injunctions and the government of Canada has said it will not use force to remove occupiers. This suggests that governments and corporations understand that the landscape of Indigenous resistance has shifted.
The asymmetry of injunctions
The Yellowhead Institute documented the use of injunctions by corporations as a tool to “deny recognition of Indigenous peoples’ inherent rights.” According to Yellowhead’s research, corporations are awarded injunctions against First Nations in 76 per cent of cases. Conversely, First Nations are awarded injunctions against corporations in only 19 per cent of cases.
One of the tests for an injunction is the relative impact on the two parties. In other words, who will suffer the greater harm?
Corporations point to the financial costs associated with blockades. In the original injunction awarded to Coastal GasLink, the judge cited a claim by the company that the blockade could cause hundreds of million of dollars in losses.
The financial considerations cannot be applied equally.
Resource extraction and transportation projects often threaten or harm Indigenous economies. But these communities are not measuring value just in terms of dollars and cents.
But what is the price tag on a people’s sovereign right to continue their way of life?
Holding Canada accountable
The solidarity blockades in Tyendinaga and across Canada are intended to speak the financial language meaningful to corporations and governments. They are succeeding.
Sean Finn, chief legal officer of Canadian National Railway, acknowledged the tactic’s effectiveness when speaking about a solidarity blockade near Smithers, B.C. He said the blockade will have “a major impact on the economy going forward” because consumer goods and commodities are unable to make it to market.
Spokespeople from business organizations representing mining, lumber, grain and more have affirmed the impact.
But the cost to corporations in Canada involves more than just lost revenue. It also means greater uncertainty.
Uncertainty in the code of capital
The bedrock of a corporation’s value is not its economic attributes. It is the relevant legal code. Katharina Pistor, a law professor at Columbia University, calls this the “code of capital.” Legal uncertainty reduces the value of a corporation’s assets.
In the present matter, legal uncertainty is compounded by the Wet’suwet’en defence of their rights and title.
The blockades across Canada have spread the uncertainty. Corporate assets lose value everywhere that Indigenous peoples contest Canada’s claim to jurisdiction.
Documents obtained by Ryerson University criminology professor Shiri Pasternak and journalist Martin Lukacs show that Canadian corporate leaders wanted “certainty through surrender” of Aboriginal title. This would increase the value of corporate assets that depend on access to land and resources.
B.C. and federal leaders did not accomplish the desired surrender. However, neither did they recognize the rights and jurisdiction of Indigenous nations.
It is within this context of unresolved uncertainty that injunctions operate.
The value of injunctions
If the Canadian government does not have sovereignty over Indigenous lands, then it does not have the right to grant access. Corporate incursions, even with permits from Canadian governments, become illegitimate and illegal.
The Wet’suwet’en refused to allow Coastal GasLink access to their lands. Therefore, it is the land defenders that are upholding the appropriate law: Wet’suwet’en law.
Rather than deal with the actual titleholders, corporations have sought protection from Canadian courts via injunctions. Injunctions are used to mitigate the uncertainty associated with Indigenous jurisdiction. However, for the Indigenous communities and their supporters, the issues are too important and too urgent for automatic compliance.
The refusal of Indigenous land defenders and solidarity protesters to accede to injunctions sends a message to all of Canada: if Canada will not comply with Indigenous laws, then they will not comply with Canadian laws.
Alberta Premier Jason Kenney has asked the Canadian government for financial assistance to clean-up abandoned oil and gas wells in the province. It has been estimated that cleaning up these wells could cost as much as $70 billion.
The existence of 77,000 abandoned wells across Alberta is the result of a financial strategy by the oil and gas business. Billions of dollars in profits and salaries reaped by oil executives are being subsidized by the public that is being asked to foot the bill.
This was not just the unfortunate outcome of a risky business operation. This type of company, and its eventual bankruptcy, is part of the financial ecosystem of the oil and gas business.
Returning Wells to Profitability
Houston’s stated purpose was to “rejuvenate legacy assets into profitable and beneficial operations.”
Over time, the amount of oil coming out of a well decreases. Eventually, the revenue earned from a well falls below the well’s operating costs. Companies like Houston can only return a well to profitability by cutting costs. If the company cannot get costs across its wells below the revenue the wells generate, then they will go bankrupt.
The Supreme Court ruled that bankruptcy does not absolve a company of its responsibility for the clean-up of unproductive wells. That means the assets of a bankrupt company can be seized by the Alberta Energy Regulator (AER) to contribute to well clean-up costs. However, often the sale of assets will not generate enough to cover all the costs. This is why companies like Houston are so useful to the broader oil and gas business.
Passing the Clean-up Liability
Imagine a big, established oil extraction company—we can call it Old MacDonald’s Oil & Gas Co.—has a bunch of wells approaching the limits of profitability; operating costs are close to revenues. They face a large future cost: cleaning up the well. Old MacDonald’s cannot just abandon the unprofitable wells. The AER can come after them. The company has lots of profitable wells and is generating returns for its investors and paying handsome salaries to its executives. It does not want to go bankrupt and disrupt this positive financial flow. But it also does not want to incur the costs associated with well clean-up. That’s where the sale to a company like Houston is useful.
If Old MacDonald’s sells the wells with waning profits to a company like Houston, then it eliminates the liability of future clean-up costs. Those liabilities shift to the buyer, which can try to cut the costs of operating the wells to squeeze more profits from them. If the buyer fails to return enough wells to profitability and goes bankrupt, then the limit of the AER cost-coverage is the assets of the bankrupt company. Neither the owners nor the executives, which may have enjoyed years of dividends and bonuses, will bear any of the liability. Old MacDonald’s will also bear no liability for the wells, since it sold them.
As the price of oil drops, well revenues will drop, meaning many more wells will cease to be profitable. This means many more wells are likely to shift to cost-cutters like Houston. Many of those are likely to be abandoned, with the costs ultimately borne by the public.
The Canadian government is considering buying out homeowners in high-risk flood zones. Let’s take this opportunity to illustrate why the constraint on governments is material not fiscal.
The buyouts are an alternative to repeated bailouts to assist homeowners recovering after a flood.
A VP with the Insurance Bureau of Canada described the problem of repeated assistance this way: “Taxpayers should no longer be on the hook for these bailouts.” However, this rhetoric misrepresents the problem.
Modern Monetary Theory (MMT) explains that governments do not use tax money when it spends. Rather, it creates money when it spends. Taxes are a way to remove some of that money from the economy. The problem of bailouts or buyouts is not a fiscal problem. The government can afford either policy.
The actual problem is the material realities of rebuilding vs retreating.
Bailouts
Consider the bailout. A community in a high-risk zone floods. Many homes are seriously damaged. Some may need to be rebuilt. The damaged and destroyed homes will produce a lot of waste.
There will be damaged concrete, carpets, flooring, siding, electrical equipment, etc. Some of the damaged stuff may be recyclable or compostable. But much of it will be waste destined for a landfill.
To replace the damaged materials will require replacement wood, cement, drywall, plastics and many other building components. Some may be recycled products, but most must be newly produced.
The homes are repaired and rebuilt but the risk remains. In the context of climate change those risks are growing worse and there is a high probability that these homes will be flooded again.
So, we once again remove much of the housing material to a landfill and replace it with newly produced materials.
From the perspective of gross domestic product (GDP), the government’s favourite measure of well-being, this is a good thing. Every time these houses are damaged and must be rebuild or repaired, economic value is created.
Any reasonable person can see the problem with this perspective. This is wasteful. By repeatedly renewing these houses we are shortening the lifespan of the materials used. GDP does not subtract for the loss of homes. It only adds for the repairs and rebuilding.
The demand for this repeated replacement material will compete with other demands for those materials. With repeated injections of government money to bailout homeowners, there is greater inflationary pressure.
We may decide this is money well-spent. Perhaps the community is so important we think this is a valuable use for the wood, cement, drywall, plastics, etc. In that case, the government should continue to fund bailouts for flood-prone homes.
We should also figure out how to make the homes more suited to a flood zone and the materials used more resilient and capable of being recycled.
If we choose bailouts, taxes could be used to reduce the risk of inflation from the repeated injections of money. Or, the government could entice increased productive capacity of the necessary rebuilding and repair inputs, ensuring adequate supplies for both the rebuilding and other purposes.
Buyouts
Now, consider the buyout. Again, a high-risk community floods. However, instead of providing money for materials to repair homes, the government buys the properties. It can remove any structures. Much of the materials will end up in a landfill although some will be recycled and composted. This time, however, no new material is placed back in the flood zone.
The homeowners can take the money from the sale of their properties and buy or build homes elsewhere. If they build homes there will be new demand for wood, cement, drywall, plastics, etc. But the homes built will be at less risk of future damage and destruction, providing value for a longer period of time. The materials that would eventually be used for rebuilding in the flood zone can be used for other purposes.
Because the buyout is one-time the policy does not repeatedly inject money and demand for building materials. Therefore, it has less inflationary pressure.
Our current discussion of government spending treats money as more substantial and consequential than what we do with the money. The government has all the money it needs. The issue is what we think we actually need and what we can actually do given the material limits.
Do we need to rebuild in high risk flood zones? What are the material constraints on rebuilding? Could we do so sustainably? What are we giving up by devoting materials to that instead of other uses? To answer that question requires much more information than just “what will it cost?”